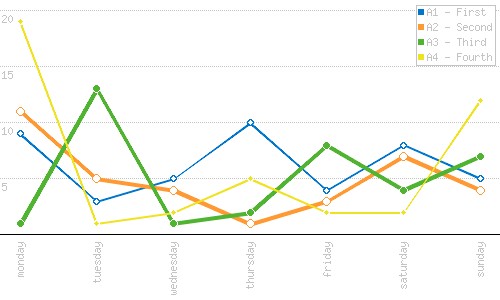
Not much of an update, but I improved my php script to generate lines graph.
Since I had the need to display more than one graph at once, here comes version 0.2.0, togehter with some other nice new features

[ad]
New features:
- Multi-graph displaying ability with independent style, color, thickness
- Possibility to display labels vertically
- Legend
Parameters:
- w: width of the graph
- h: height of the graph
- p[]: comma separated values representing the points in the graph
- l: comma separated labels
- r: number of rows
- c[]: the desired color in rgb format, comma separated values (r,g,b)
- s: comma separated values representing the style of the graph: 1) bordered circle endpoints 2) filled circles endpoints
- t: comma separated values representing thickness of the graph
- i: comma separated legend labels
Here’s the parameter used to generate the image above:
graph.php?w=500&h=300&p[]=9,3,5,10,4,8,5&p[]=11,5,4,1,3,7,4&p[]=1,13,1,2,8,4,7&p[]=19,1,2,5,2,2,12&l=monday,tuesday,wednesday,thursday,friday,saturday,sunday&r=4&c[]=0,119,204&c[]=255,153,51&c[]=80,180,50&c[]=239,226,289&s=1,1,2,2&v=0&t=2,4,4,2&i=A1%20-%20First,A2%20-%20Second,A3%20-%20Third,A4%20-%20Fourth
If you’re brave enough, here’s the download link:
graph_0.2.0.zip (1864 downloads ) ElvenProgrammer
Pingback: Google Chart Tools vs. Google Chart Image APIs – ElvenProgrammer | ElvenProgrammer
This looks really good, just what I’m after, would you be ok with me using it on my website to display on my admin page to show usage of my site?
Dan