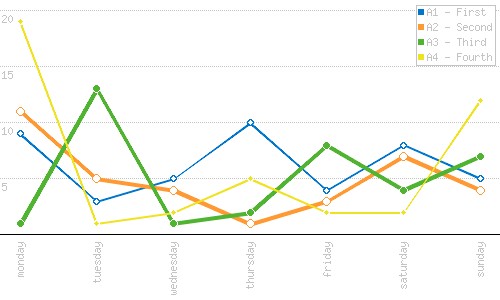
Not much of an update, but I improved my php script to generate lines graph.
Since I had the need to display more than one graph at once, here comes version 0.2.0, togehter with some other nice new features

 ElvenProgrammer
Not much of an update, but I improved my php script to generate lines graph.
Since I had the need to display more than one graph at once, here comes version 0.2.0, togehter with some other nice new features

Since I was tired of creating ugly bar graphs I decided to explore an easy way to create a lines graph, mostly inspired by Google Analytics graphs. Ok nothing so advanced but the result is quite nice for my needs.
You can configure the image created by the script using the following parameters:
Following a couple of examples with parameters used:
graph.php?w=500&h=300&points=9,3,5,2,4,8,5 &labels=mon,tue,wed,thu,fri,sat,sun&rows=4 &color=0,119,204&style=1