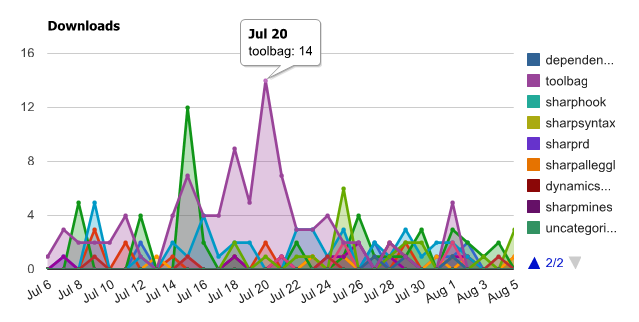
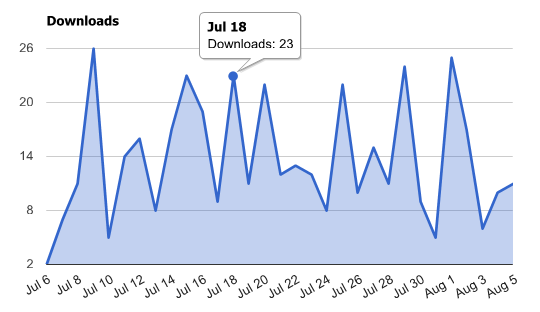
In another attempt of increasing my website page ranking and SEO, trying to understand the trends of my followers, I decided to improve my download statistics page.
The old one used to be a custom page where I needed to develop some easy charting tool (PHP lines graph tool).
Time passed and I decided to try a new approach, and one of the best examples I could find around was Google Analytics. Unfortunately the flash based chart inside analytics seems to remain a secret, but Google offers not one, but two free services to create your own charts (In my case line/area charts).
The first one I found was Google Chart Image APIs which works very similar to the php script I developed, of course it is a lot better and supports a gazilion of features.
I was quite satisfied, but suddenly, while looking for some more documentation, I stepped on Google Chart Tools. Actually that’s even more interesting.
Just to say some of the cool features it adds:
- No width limit
- Javascript based, allowing for async calls
- Automatic data mapping, take a look at the tooltip in the screenshot
Continue reading to uncover image and source examples of the two approaches compared
[ad]
Google Chart Image APIs
https://chart.googleapis.com/chart?&cht=lc&chs=700x350&chtt=Downloads&chd=t:2,7,11,26,5,14,16,8,17,23,19,9,23,11,22,12,13,12,8,22,10,15,11,24,9,5,25,17,6,10,9&chds=a&chl=Jul 11|Jul 18|Jul 25|Aug 1&chco=3D7930&chm=B,C5D4B5BB,0,0,0|o,3D7930,0,-1,6.0&chg=23.333333333333,50,0,0,16.666666666667,0&chxt=x,y&chxp=0,5,12,19,26&chls=3&chxr=0,0,30|1,0,26 |
[ad]
Google Chart Tools
<script type="text/javascript" src="https://www.google.com/jsapi"></script> <script type="text/javascript"> google.load("visualization", "1", {packages:["corechart"]}); google.setOnLoadCallback(drawChart); function drawChart() { var data = new google.visualization.DataTable(); data.addColumn('string', 'Day'); data.addColumn('number', 'Downloads'); data.addRows([ ["Jul 6",2 ],["Jul 7",7 ],["Jul 8",11 ],["Jul 9",26 ],["Jul 10",5 ],["Jul 11",14 ],["Jul 12",16 ],["Jul 13",8 ],["Jul 14",17 ],["Jul 15",23 ],["Jul 16",19 ],["Jul 17",9 ],["Jul 18",23 ],["Jul 19",11 ],["Jul 20",22 ],["Jul 21",12 ],["Jul 22",13 ],["Jul 23",12 ],["Jul 24",8 ],["Jul 25",22 ],["Jul 26",10 ],["Jul 27",15 ],["Jul 28",11 ],["Jul 29",24 ],["Jul 30",9 ],["Jul 31",5 ],["Aug 1",25 ],["Aug 2",17 ],["Aug 3",6 ],["Aug 4",10 ],["Aug 5",9 ] ]); var chart = new google.visualization.AreaChart(document.getElementById('chart_div')); chart.draw(data, { width: 700, height: 350, title: 'Downloads', legend: 'none' }); } </script> |
 ElvenProgrammer
