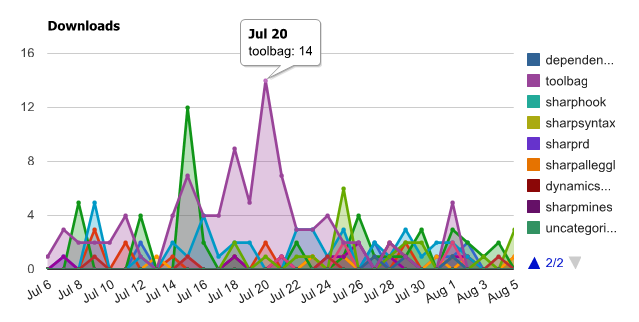
In another attempt of increasing my website page ranking and SEO, trying to understand the trends of my followers, I decided to improve my download statistics page.
The old one used to be a custom page where I needed to develop some easy charting tool (PHP lines graph tool).
Time passed and I decided to try a new approach, and one of the best examples I could find around was Google Analytics. Unfortunately the flash based chart inside analytics seems to remain a secret, but Google offers not one, but two free services to create your own charts (In my case line/area charts).
The first one I found was Google Chart Image APIs which works very similar to the php script I developed, of course it is a lot better and supports a gazilion of features.
I was quite satisfied, but suddenly, while looking for some more documentation, I stepped on Google Chart Tools. Actually that’s even more interesting.
Just to say some of the cool features it adds:
- No width limit
- Javascript based, allowing for async calls
- Automatic data mapping, take a look at the tooltip in the screenshot
Continue reading to uncover image and source examples of the two approaches compared
 ElvenProgrammer